

METHODS
Using various ion chambers, measurements of the percent depth dose (PDD), off-center ratio (OCR),
and output factor (OF) datasets in square areas between 2×2 and 50×50 mm2 for beam modelling in
Monaco TPS were collected, and dosimetric differences were compared. The types of used detectors
were PTW PinPoint 31014, IBA CC04, IBA CC01, IBA CC13 and Exradin A16, respectively. The effect
of the detector type on the OCR was evaluated by including penumbra width of fields, full width half
maximum value (FWHM) and FFF beam specific unflatness value. The PDDs were compared using
depth of dmax, d5 and d10. Also, the differences between OFs of each field and institution were analyzed
with and without correction factor.
RESULTS
The largest observed variance in dmax was 3 mm for a few institutions, whereas the majority of institutions
agreed with GBD dmax values within 2 mm. The agreement of the median PDD values with GBD was all within ±2%. The maximum deviation was under 2% for the shoulder part and 1% for the center
part of the OCR profiles for all field sizes. The maximum deviation of the penumbra and FWHM
value observed for all field sizes at certain institute OCR data was considered a user-dependent effect
instead of a detector. The relative percent difference both the OFuncorr and the OFcorr compared with
GBD for all field sizes was within ±3%.
CONCLUSION
The findings of this study obtained via a large multicentre study can be considered as an external crossverification
for Versa HD users doing beam data collection of Monaco and should help to offer accurate
TPS modelling of small fields and minimize the uncertainty of SRS and SBRT. Our results emphasized
that the use of several dosimetric systems, comparison of golden beam data, and multi-institutional
review are required.
Keywords: Beam data commissioning; FFF; small-field dosimetry
Recently, the International Atomic Energy Agency
(IAEA) published a new formalism for practice[
The use of IMRT and VMAT does not require a flat
beam profile the modulated beams by the multileaf collimator
(MLC)s were used for the required homogenous
dose distribution at the planning target volume (PTV)
as well as inhomogeneous dose distribution when desired.
Therefore, the use of flattening filter-free (FFF)
beams of linear accelerators with available high dose
rates by removing the flatting filter is becoming more
useful in many MUs per fraction treatment techniques
to be shortened treatment delivery times such as SRS
and stereotactic body radiotherapy (SBRT). The Agility
MLC system of Versa HD (Elekta Oncology Systems,
Crawley, UK) linear accelerator (Linac) comprises 160
leaves with a width of 0.5 cm at the isocenter and supports
6MV-FFF photon beam with dose rates of 1400
Monitor Units (MUs) per minute (MU/min). SRS/SBRT
techniques planned with IMRT/VMAT require an accurate
small field beam modelling using a suitable smallfield
dosimetry detector with a high spatial resolution,
low energy dependency and independence of dose rate
either as mentioned above for flattened beams or especially
for FFF beams and stability.[
In this study, we collected small fields (≤5 cm2) beam
data measurements of 6MV-FFF beam including cross
profiles comprising left-right and gun-target direction,
PDD, and output for Versa HD linac for modelling a
Monaco TPS from multiple institutions to investigate
the beam data variation among the institutions and determine
their dependency based on used detectors. The
purpose of our work is to identify, analyze and quantify
the variation among institutions and determine the effects
of the ion chamber's behaviors to be observed in
the scanning and OF measurements during collecting
beam data for Monaco TPS modelling. Identification
of these variations caused by using different ion chambers
and the specific circumstances under the variations
among institutions that can be observed should help
medical physicists to constitute beam modelling accurately
into the Monaco TPS. Although numerous authors
have published experimental studies[
Furthermore, as recommended in the TG-106 report[
All Scan measurements including PDDs and offcenter
ratio (OCR) profiles were performed at 90 cm
SSD. The profile depths were dmax of the 6 MV-FFF
beam of each machine, 5, 10, and 20 cm. The chamber
position correction was done to check the effective
point of measurement with the following of each
chamber type's specification[
Analysis of The Collected Beam Data
Diff(%)DD=((DDmed(d)-DDGBD(d))/DDGBD(d))×100 (1)
Diff(%)DD=((DDi(d)-DDmed(d))/DDmed(d))×100 (2) where DDmed(d), DDi(d) and DDGBD(d) are the
depth doses at depth (d) of the median value calculated
from the depth dose graph of the multiple institutions
for each data point, the depth dose value of i of institute
and GBD, respectively.
All PDD were normalized at the maximum depth
of the graph where the depth was accepted by the
dmax value of each field size. Furthermore, PDDs at
the dmax, depth of 5 cm called d5, and depth of 10 cm
called d10 dose values of each field size were compared
with corresponding GBD values and the median values
of these depths.
The differences of the profiles in both crossplane
and inplane directions at dmax and d10 depths of each
institution's measured profiles from the corresponding
profiles and depths of the median data and the GBD at
each (x,y) coordinates were calculated for half part of
the profiles using the equations (3,4):
Diff = (OCRmed(x,y,d)-OCRGBD(x,y,d))/OCRGBD(d) (3)
Diff = (OCRi(x,y,d)-OCRmed(x,y,d))/OCRmed(x,y,d) (4)
where OCRmed(x,y,d), OCRi(x,y,d) and OCRGBD(x,y,d)
are off-axis ratio of the median profile of the institutions,
i of each institute and GBD, respectively, at crossplane
(x), inplane (y) and d depth coordinates. Before
the calculation of the differences at any (x,y,d) position, each profile was shifted to the center of its full width
half maximum (FWHM) to eliminate set-up variation
among the institutions using GNU Octave programing
language with in-house programs code.
Because of the combined detector and machine-related
effects, measuring and deriving field size width in
small fields is a challenging issue, the uncertainty of the
measured radiation field widths of the institutions was
investigated by comparing the FWHM of the crossline
profile of the fields which scanned according to the alignment
recommendations in beam modelling guide with
the aforementioned detectors placed perpendicular the
scan direction to minimize stem effect of the detectors.
The measured OCR profiles of field sizes of 20×20, 30×30,
and 50×50 mm2 with resolutions of 1mm were evaluated
in terms of FWHM derived from crossline at depth of
dmax and d10. The penumbral width from 80% to 20% on
either side of the off-axis ratio was also compared. Furthermore,
the deviation of the dosimetric field defined by
FWHM and penumbra of measured OCR with various
detectors from GBD has been derived by calculating with
in-house code in OCTAVE math platforms.
Unflatness value, which is an FFF beam-specific
parameter described by Fogliata et al.[
Additionally, the study assessed the impact of detector-
related difficulties on output values, which were
greatly impacted by small field sizes. The detector
reading output values of each institution for field
sizes ranging from 20×20 mm2 to 50×50 mm2 were
normalized to the detector reading value of field size
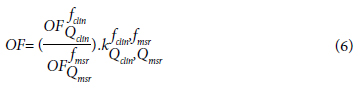
of 100×100 mm2. To minimize the effect of change
in detector response and to evaluate inter-institutional
variability, OF values were corrected using
output correction factors(kQclin,Qmsr fclin, fmsr) fclin,fmsr obtained from a
recently published technical report by the International
Atomic Energy Agency (IAEA) and the American
Association of Physicists in Medicine (AAPM)
TRS-483 code of practice.[
All mathematical analyses and the graphing process
were performed using GNU Octave programing language
with in-house programs code. The analysis of
the measured PDD scans with field sizes from 50×50
mm2 down to 20×20 mm2 of all institutes was done by
comparing with generated the median PDD curves using
calculated the median value at each depth to obtain
inter-institutional variability and calculating the deviation
from the GBD for respective field sizes. Because
the calculated beam modelling data of the Monte Carlo
dose calculation algorithm in the Monaco treatment
planning system could vary between institutions, the
measured beam data collected from multiple institutions
and the GBDs measured using a diode detector
were used for comparison rather than the calculated
beam modelling data of each institution. The differences
in PDDs of each institution" and the median of
the all measured PDDs from the GBD of corresponding
relevant field sizes at each depth (d) were calculated
using the following equation (1,2):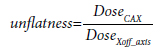
Furthermore, the percentage dose readings at 5
cm and 10 cm depths were compared with golden
beam data values for PDD analyses as indicated in
Table
Figure
PDD: Percent depth dose; GBD: Golden beam data.
As shown in Figure 1, there were no substantial deviations in the dmax region for all field sizes, excluding form surface to build-up area, but the variations from the GBD data increased with depth. Overall PDD curves of all field sizes were evaluated, and it was observed that the deviations from the GBD reached saturation at 13 cm depth and started after the build-up zone, and the maximum variances were less than 2% and 3% with the measurements of the majority of centers up to 10 and 20 cm depth, respectively.
As can be seen in the PDD curves for each field size in Figure 1, the maximum deviation values were obtained at the institute of 5th and 12th for the 20×20 and 30×30 mm2 field sizes, and the institute of 5th for the 40×40 mm2 field size, utilizing the Pinpoint and CC01 ionization chambers, respectively. At a field size of 50×50 mm2, which is a relatively large field size according to the definition of the small field size by Das et al.,[1] the deviations from GBD increase dramatically with increasing depth, and the variation from GBD in PDDs exceeds 4% at depths greater than 10 cm in measurements performed by the seventh, ninth, and twelfth institutions by using CC04, CC13, and CC01 (IBA Dosimetry, Schwarzenbruck, Germany) ionization chambers, respectively.
Figure
PDD: Percent depth dose; GBD: Golden beam data.
Analyses of OCR Profiles
The inline and crossline OCR curves were plotted at
dmax and 10 cm depth with their centers corrected to
eliminate the set up error of the measured field size
following the Monaco TPS beam modelling guide supplied
by the manufacturer and were compared with
their corresponding median and golden beam OCR
profiles. Figure
OCR: Off-center ratio; GBD: Golden beam data.
Table
The effect of volume averaging of these microchambers is what causes FWHM deviations to be dramatically higher than GBD values for CC01, Pinpoint, and A16. As a result of this effect, it was expected that FWHM would have a smaller measurement than GBD; however, the deviation in the FWHM value for profiles of all field sizes measured by 12 of the institute using CC01 was positive, indicating that the FWHM value was detected in a wider direction for this chamber measurement.
In order to summarize the result of FWHM for all measured field sizes, while differences of less than 1 mm were observed in measurements taken at other institutions for a field size of 20×20 mm2, -1.9 mm was calculated for the profile measured by the 31022 Pinpoint chamber. In the 30×30 mm2 area, FWHM values differed by -2.7 mm in the profiles of Institution 1, -2.9 mm in the profiles of Institution 11, and 3.3 mm in the profiles of Institution 12, while differences of less than 1mm were observed in measurements from other institutions. Finally, the result of the FWHM variation from GBD's values in 50×50 mm2 were found to be similar to the aftermentioned field sizes, with narrower FWHM values than GBD of 5.2 mm differences for institutions 1, 11, and a wider FWHM value than GBD for institution 12, respectively. The agreement between other institutions was less than 0.5 mm for the largest field sizes of 50×50 mm2.
Although the discrepancies in penumbra widths
between institutions and GBD were not significantly
different, the largest differences of 1.4, 1.7, and -1.4
mm occurred in the crossline profiles of 20×20, 30×30,
and 50×50 mm2 field sizes measured by the CC04 and
CC01, CC04, and A16 chambers, which belong to institute
numbers 8 and 12 for a field size of 20×20 mm2,
8, and 11, respectively. The A16 ion chamber with the
smallest volume determines the penumbra value with
the minimum difference from GBD in 20×20 and
30x30 mm2 areas, as shown in Table
The maximal deviation from the GBD in terms of the unflatness value calculated with Eq (5) for a 20×20 mm2 field size was observed to be 4.5% in the profiles taken with the 31023 Pinpoint and CC04 ion chambers from the 2nd and 8th institutes, respectively. Conversely, the profiles measured with the CC01 and A16 detectors, which have a smaller volume than the other detectors, provided the best fitting for the 20×20 mm2 area, with a 0.3% agreement. Even though the unflatness values in the 50×50 mm2 field of all institutes were found to be compatible with GBD with an agreement of less than 1%, the field size of 30×30 mm2 for the profile taken with the 31022 Pinpoint chamber revealed the largest deviation of 3.2%.
Output Factor Differences
As listed in Table
The right upper and low columns of Figure
Figure 4 demonstrates the values of the uncorrected
OF (OFuncorr) and the corrected OF with the kfclin,fmsr
Qclin,Qmsr
output correction factors derived from the TRS483[
OF: Output factor.
When the DD curves are evaluated for all field sizes
until the dmax value is reached, that is, after the absorbed
dose with Kerma is equalized, both the inconsistency
within the ion chambers and the deviation from the
GBD are quite high due to the differences in the ability
of the detectors to measure the surface dose as illustrated
in Figure 1. Therefore, a large variation was
observed in the surface doses as similar results of the
Mamballikalam et al.[
During the measurement of the profiles, it can be
difficult to accurately characterize the beam's edges,
particularly for small field sizes where the beam profile
rapidly falls off, with variable degrees of broadening of
the beam's edges occurring as a function of the active
volume of the scanning chamber. As noted in previous
research,[
The selection of detectors is a crucial step in small
field output factor measurements as the size of the detector
and the material of the central electrode can significantly
affect the accuracy of the readings. Inaccurate
measurements can lead to under or overestimated
readings, resulting in imprecise monitor unit (MU)
calculations in the patient's treatment plan. As summarized
in TG155,[
Despite the fact that all detectors used by 13 institutes
were suitable for collecting beam data with field
sizes ranging from 20×20 to 50×50 mm2 in this study
when the OF values were corrected by output correction
factors, the variations from GBD values were
greatly reduced, with the maximum variation of OF
measured with an A16 microchamber, which has the smallest volume, observed at field size 20×20 mm2
due to detector-dependent behavior. In this investigation,
the electrode of the Exradin A16 microchamber
is comprised of materials with silver-plated coppercovered
steel, which has a higher atomic number than
other microchambers, which predominantly contain
Al (Z:13). The overresponse of the A16 microchamber
OF value can be explained by the high effective atomic
number of the electrode, which increases the probability
that electrons will be created, thereby contributing
to a higher dose in the smaller ion chambers that contain
the higher-Z central electrode.
However, the variation of the OF even same model
of a detector has large variations after applying the
correction factors tabulated in Table
In addition to the detector effect on beam collection
measurements, it should be considered that differences
in the type of dosimetry equipment, including the water
phantom, reference chamber for scanning data used
by each institute, and set-up of the equipment can affect
OCR parameters such as FWHM and penumbra,
which can cause uncertainty in the study. Although the
detector difference used during the measurements in
the study is wide, the absence of solid state detectors
such as diode or diamond and the number of participant
institutes which is 13 in this study can be considered
other limitations of the present study the median
data of the 6 MV FFF small field measurements may not
be sufficient to use as an alternant to GBD supplied by
the vendor. Despite the existence of a few multicenter
studies for small area measurements and even national
campaigns,[
Although the GBD has been clinically used worldwide
and can be used as good reference data, we also generated the median data for 6 MV FFF small fields
from participant Versa HD users, which includes interuser
and detector-dependent variations to account for
possible differences in commissioning measurements,
which will aid in the as a supplementary verification
tool for Versa HD users to validate their TPS measurements
prior to clinical implementation.
Peer-review: Externally peer-reviewed.
Conflict of Interest: All authors declared no conflict of interest.
Financial Support: None declared.
Authorship contributions: Concept - C.C.; Design - C.C., B.G., A.Y., S.G.; Supervision - C.C., B.G., A.Y., S.G.; Materials - C.C., B.G., A.Y., S.G., S.Y.İ., E.K., Ö.Ö., A.K., V.A., T.B., T.U., Y.S., S.C., İ.F.D.; Data collection and/or processing - C.C., B.G., A.Y., S.G.; Data analysis and/or interpretation - C.C., B.G., A.Y., S.G.; Literature search - C.C., B.G., A.Y., S.G.; Writing - C.C.; Critical review - C.C., B.G., A.Y., S.G.