

METHODS
Image acquisition and quality control tests were investigated according to the standards of NEMA NU
2-2007 using NEMA phantom and recommended image acquisition techniques. The phantom consists
of lesion-like hot spheres of diameters 10, 13, 17, and 22 mm filled with 8:1 18F activity ratio to background.
The remaining 28 and 37 mm cold spheres were filled with water only. A 700-mm linear line
source was prepared with 3.08 mCi (140.6 MBq), and all essential ROIs were drawn after image acquisition
to calculate contrast.
RESULTS
In PET/MR, the average contrast of 10, 13, 17, and 22 mm diameter hot spheres in the phantom was 56%,
72%, 78%, and 85%, respectively. While the contrast of 10, 13, 17, and 22 mm diameter hot spheres in
PET/CT was 53%, 66%, 72%, and 79%, respectively.
CONCLUSION
PET/MR image contrast was higher than PET/CT by 9%.
Keywords: PET/MR, PET/CT, NEMA tests, image quality
One of the most effective factors for PET/MR and
PET/CT image quality is photon attenuation correction
method. The attenuation correction coefficients
for PET/CT images are obtained from CT map derived
from images of the patient. This process is performed
in several ways using different methods in PET/MR,
which most commonly include attenuation correction
algorithms using MR-based images; another method is
using attenuation coefficients obtained from standard
human phantom CT images.[
Conventional photon multiplier tubes (PMTs) of
the PET model have been replaced with nonmetallic PMTs to prevent MR effect on the ferromagnetic objects
inside the PET/MR gantry. The most common
semiconductor detectors are silicon photomultipliers
(SiPM) and avalanche photodiodes (APD). Semiconductor
material detectors are superior to PMTs in
terms of signal efficiency.[
National Electrical Manufacturers Association
(NEMA) test standards for PET scanners were last renewed
in 2007. One of the NEMA tests recommended
for PET is given a title of "image quality." In the image
quality test, NEMA IQ phantom is used to measure
the contrast of the lesions of hyperactive, hypoactive,
and lung-like object of the phantom.[
The aim of this study was to compare image qualities
in PET/MR and PET/CT devices, with identical
properties of PET modules, using standard quality
control phantoms and the standard method (NEMA
method).
NEMA IQ (body) phantom: According to NEMA NU
2-2007 standards, the image quality of PET scanners is
made with Standard NEMA image quality phantom.[
The objects adhered in the phantom of image quality
imitate the human head, and the polyethylene scattering
phantom is attached to the tip of the phantom
simulating the lower body trunk. The phantom is made
of plexiglas material with water equivalent-attenuation
coefficient (1.18 g/cm³), comprising different sizes of
spheres. The low-density pipe (0.3 g/cm³) in the middle
filled with styrofoam represents the lungs. The inner
diameters of the six fillable spheres are 10, 13, 17, 22,
28, and 37 mm (Fig.
Phantom Preparation and Imaging: The room in the
phantom was filled with 18F mixed with water at a homogeneous
concentration of 0.14 µCi/ml (5.18 kBq/
ml). Hot spheres activity ratio might be 8:1 to background.
Two large spheres of 28 and 37 mm diameters
were filled with water for cold lesion imaging, and the
other spheres were filled with 18F at a concentration
of 1.12 µCi/ml (41.44 kBq/ml). The line source is prepared
with 5 mCi (185 MBq) 18F and inserted in the
polyethylene phantom. The phantoms were placed over
patient"s bed after filling and then imaged for 30 min (Fig.
NEMA Image Quality Parameters: According to
NEMA NU 2007 protocol, two necessary parameters
in the quality of PET images should be evaluated: contrast
and background variability. Lesion contrast estimation
was performed using equations 1 and 2.[
CH,J = j average counts of hot sphere"s ROI
CC,J = Average ROI counts within background spheres
During analysis, all hot and cold spheres located in
transverse sections were involved by drawing circular
ROIs on the outer contour of each sphere. For background
determination, 12 ROIs were drawn outside
the hot and cold spheres.
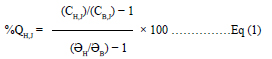
CB,J = j average counts of backgraund"s ROIs drawn for
hot sphere
aH = Hot sphere"s activity concentration
aB = Backgraund"s activity concentration
The contrast value for spheres without radioactivity
was calculated using equation.[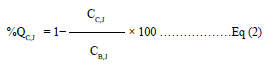
CB,J = Average ROI counts for all background spheres
Contrast values for background ROIs were found as 8%, 6%, 5%, 5%, 6%, and 6%. The error value for lung tissue remaining activity was measured as 1.2%. The limit error rate given by the manufacturer is 10%.
The contrast values for the 10, 13, 17, and 22 mm diameter hot spheres of NEMA IQ phantom in PET/ CT with CT-based attenuation correction in addition to the limit values given by the manufacturer to these lesions are shown in Table 1. The contrast values for background ROIs were 11%, 7.2%, 6.1%, 4.1%, 3.8%, and 3%. The error value for lung tissue remaining activity was measured as 12.2%. The limit error rate was 20%, as given by the manufacturer.
Standard uptake value values of the lesions were
compared using PET/MR and PET/CT images obtained
under equal conditions; statistical significance was not
found between the results.[
MR-based (Dixon) and CT-based attenuation correction
algorithms have been used to acquire NEMA
IQ phantom images by PET/MR. CT attenuation coefficients
extracted from the standard phantom were applied
again to the standard NEMA IQ phantom. The
result of the study indicated that quality of the images
was better with CT-based attenuation correction.[
In our study, NEMA IQ phantom was used. However,
unlike other studies, MR-based Dixon algorithm
in PET/MR and CT-based attenuation correction algorithms
in PET/CT were applied for phantom imaging.
Another difference of our study from other studies
is that the influence of different algorithms on image
quality is investigated in two different imaging systems
with the same PET modules. Boellaard et al. performed
a multi-center study using NEMA image quality phantom
on PET/MR of three different vendors and obtained
quantitative values in PET/MR. As a result of
the study, it was reported that image quality differences
between devices can be determined using NEMA image
quality phantom in PET/MR devices.[
Karlberg et al. carried out NEMA tests using Siemens
PET/CT with TOF and PET/MR without TOF.
They reported comparable results of sensitivity, noise
equivalent count rate, and lesion contrast. The performance
evaluation was elevated in PET/MR because of
the TOF technology.[
In our study, all hot lesions had a 9% higher average
contrast measurement in PET/MR than in PET/
CT. These findings are thought to be due to the high
efficiency of PET detectors that are attached to highquality
SiPM material in PET/MR systems as well as a
special type of MR-based algorithm (Dixon) for attenuation
correction.
Disclosures Statement
Ethics Committee Approval: This study was conducted inaccordance
with local ethical rules.
Peer-review: Externally peer-reviewed.
Conflict of Interest: None declared.
Authorship contributions: Concept - .........; Design -
.........; Supervision - ..........; Materials - ........; Data collection
&/or processing - ..........; Analysis and/or interpretation
- ........; Literature search - ..........; Writing - ..........; Critical
review - ...........
The authors declare no conflicts of interest.